The 17.1% E-Commerce Share Is Not a Payments Number
The US Census Bureau reported on 18 August that e-commerce accounted for 17.1% of American retail sales in the second quarter of 2026, on sales of $340.2 billion. For anyone in payments, two things in the release matter more than the headline. The same release publishes a second, lower share for the same quarter. And the Bureau's own definition says the figure does not measure online payment.
August 19th, 2026
Last updated: August 19
Key takeaways
- US retail e-commerce reached $340.2 billion in Q2 2026, 17.1% of total retail sales on a seasonally adjusted basis.
- The same release gives 16.4% for the same quarter on an unadjusted basis, a gap of 0.7 percentage points.
- The Census definition states plainly that payment may or may not be made online; the figure counts orders.
- E-commerce grew 12.2% year on year against 6.7% for retail overall, roughly 1.8 times the rate.
- Share still moved only 0.8 points in a year, from 16.3% to 17.1%, because the base is large.
- Since the April 2025 benchmark the series excludes nonemployers, so older comparisons are not like-for-like.
Data highlight
0.7percentage points
Gap between the seasonally adjusted and not adjusted e-commerce share of US retail sales for Q2 2026
Second quarter of 2026, released 18 August 2026
The Census Bureau published an e-commerce share of 17.1% for the second quarter of 2026 on a seasonally adjusted basis, from $340.2 billion of e-commerce against $1,986.5 billion of total retail sales, and 16.4% on a not adjusted basis, from $329.5 billion against $2,012.0 billion. HaiPay subtracted the two published shares. The two series also disagree on direction over the quarter: adjusted, the share rose from 17.0%; not adjusted, it fell from 16.7%. Neither figure is more correct than the other; they answer different questions. Estimates are not adjusted for price changes, and the Bureau publishes margins of error of plus or minus 0.4 points on the quarterly change and 0.9 points on the annual change.
The US Census Bureau reported on 18 August that e-commerce accounted for 17.1% of American retail sales in the second quarter of 2026, on sales of $340.2 billion. The share is a record and the growth rate, 12.2% year on year, is close to double the 6.7% for retail as a whole.
For anyone in payments, two things in the release matter more than the headline. The same release publishes a second, lower share for the same quarter. And the Bureau's own definition says the figure does not measure online payment.
The statistic counts orders, not payments
The definition sits in the first footnote of Table 1, and it is unusually explicit.
The Bureau defines e-commerce sales as sales of goods and services where the buyer places an order, or where the price and terms of the sale are negotiated, over an internet, mobile device, extranet, EDI network, electronic mail or other comparable online system. It then adds a sentence that is easy to skip: payment may or may not be made online.
That single clause separates this number from anything a payments business would recognise as online payment volume. A car configured and priced online but paid for at the dealership counts. A wholesale order placed over an EDI link and settled by bank transfer on 30-day terms counts. A restaurant order placed in an app and paid in cash on delivery counts. Conversely, a card-present transaction at a till does not count, however electronic the payment itself was.
The 17.1% is a measure of where the commercial transaction was arranged. It is not a measure of where the money moved.
Two official shares, 0.7 points apart
The release gives two versions of the same quarter, and the difference between them is larger than the entire year's movement in the headline series.
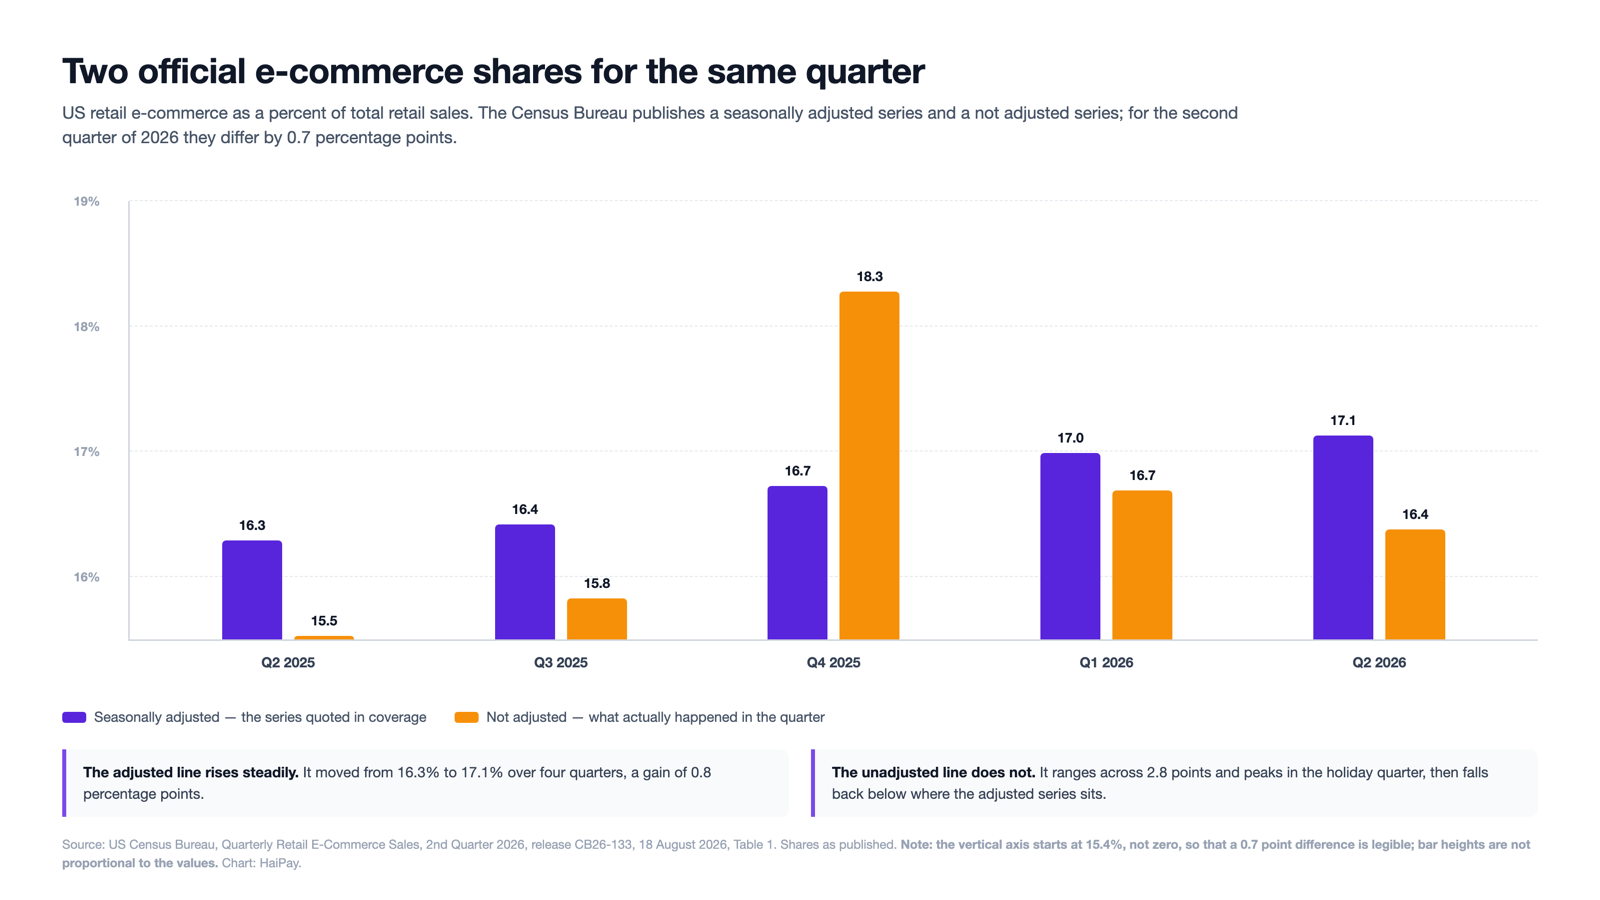
Figure 1. Two official e-commerce shares for the same quarter. US retail e-commerce as a percent of total retail sales, seasonally adjusted and not adjusted. Source: US Census Bureau, Quarterly Retail E-Commerce Sales, 2nd Quarter 2026, release CB26-133, Table 1. The vertical axis starts at 15.4%, not zero. Chart: HaiPay.
Seasonally adjusted, e-commerce was $340.2 billion against total retail of $1,986.5 billion, giving 17.1%. Not adjusted, the same quarter was $329.5 billion against $2,012.0 billion, giving 16.4%. The gap is 0.7 percentage points, and the two series disagree about direction: adjusted, the share rose from 17.0% in the first quarter; unadjusted, it fell from 16.7%.
Neither number is wrong. Seasonal adjustment exists to strip out the fact that fourth quarters are not like second quarters. But the adjusted series is the one that gets quoted, and it is a modelled figure rather than a count of what happened between April and June.
The unadjusted series shows why the adjustment is applied. Across the five quarters in the release it ranges from 15.5% to 18.3%, a spread of 2.8 percentage points, peaking in the 2025 holiday quarter. The adjusted series over the same period moves only from 16.3% to 17.1%.
For a merchant sizing peak capacity, the unadjusted number is the operational one. For anyone describing a trend, the adjusted number is the right one. They should not be quoted interchangeably, and in the second quarter of 2026 the choice moves the answer by 0.7 points.
The growth gap is the real signal
Share of retail is a slow-moving number, and reading it alone understates what is happening underneath.
Year on year, e-commerce grew 12.2% while total retail grew 6.7%. E-commerce is expanding at roughly 1.8 times the rate of the market it sits inside. Yet the share moved only from 16.3% to 17.1% over the same four quarters, a gain of 0.8 percentage points.
Both facts are true simultaneously because the base is large. Arithmetic on a 17% share means a sizeable growth premium converts into a fraction of a point per quarter. Anyone forecasting from the share alone will consistently underestimate the volume growth; anyone forecasting from the growth rate alone will consistently overestimate how quickly the mix shifts.
The Bureau also publishes confidence intervals that coverage generally drops. The quarter-on-quarter e-commerce change of 3.8% carries a margin of ±0.4 percentage points, and the 12.2% annual change carries ±0.9 points.
The series changed basis last year
A second footnote records a break that matters for anyone comparing today's figure with older ones.
Estimates now include data only for businesses with paid employees. Before the benchmark report released in April 2025, the quarterly e-commerce estimates also included nonemployers — businesses with no payroll, which in retail means a long tail of sole traders and marketplace sellers.
That is a change in what the series counts, not a revision to it. Comparisons that cross the April 2025 boundary are not like-for-like, and a chart of e-commerce share running back to 1999 without a break marker is quietly splicing two different definitions.
What the release does and does not tell you
Established: US retail e-commerce was $340.2 billion in the second quarter of 2026 on a seasonally adjusted basis, 17.1% of total retail sales of $1,986.5 billion, up 3.8% on the quarter and 12.2% on the year against 6.7% for retail overall. On an unadjusted basis the same quarter was $329.5 billion and 16.4%. The first-quarter and prior-year figures were revised. The third-quarter estimate is scheduled for 19 November 2026.
Not established: how much of that $340.2 billion was paid for online, what share was card, wallet, bank transfer or invoice, how much was cross-border, what the average order value was, how the total splits between marketplaces and direct merchants, and how much of the growth is price rather than volume — the Bureau states the estimates are not adjusted for price changes.
The defensible reading is that online ordering keeps taking share from offline ordering at a steady and unspectacular rate, that the headline number depends on which of two official series is quoted, and that a payments business should not treat any of it as a measure of online payment volume.
How to cite
HaiPay News, "The 17.1% E-Commerce Share Is Not a Payments Number", https://www.haipay.net/news/census-q2-2026-ecommerce-share-definition, August 19th, 2026
About the author
Crystal
Digital Public Relations
A digital PR specialist with a Master's in Journalism & Communication from UNSW. Started as an intern at ABC Australia, now leads public relations at Haipay, crafting press releases and media strategies that bring brand stories to life.
Reviewed by WeiJun TangEditorial policy
2 sources
Discover More

Amazon Business Card Cutover Has Seven Dates, Not One
5 sources
Tariff Refunds Reach $100 Billion. Tracing Them to Shoppers Is the Hard Part
5 sources
HaiPay and DeepClick Partner to Link Ad Performance With Cross-Border Payment Settlement
1 sources
Worldline Brings Click to Pay to Recurring Payments in Europe
2 sources