NewsLocal Payments
Americans Wrote 9 Billion Checks in 2024: 79% of the Total
Americans wrote 8.99 billion checks in 2024, 79.3% of all checks reported by 23 economies in BIS payment statistics. The number of US checks is falling more slowly than elsewhere, and the average check rose from $1,917 in 2018 to $3,207.
Key takeaways 6
- The US wrote 8.99 billion checks in 2024, 79.3% of the 11.35 billion reported by 23 economies, BIS data show.
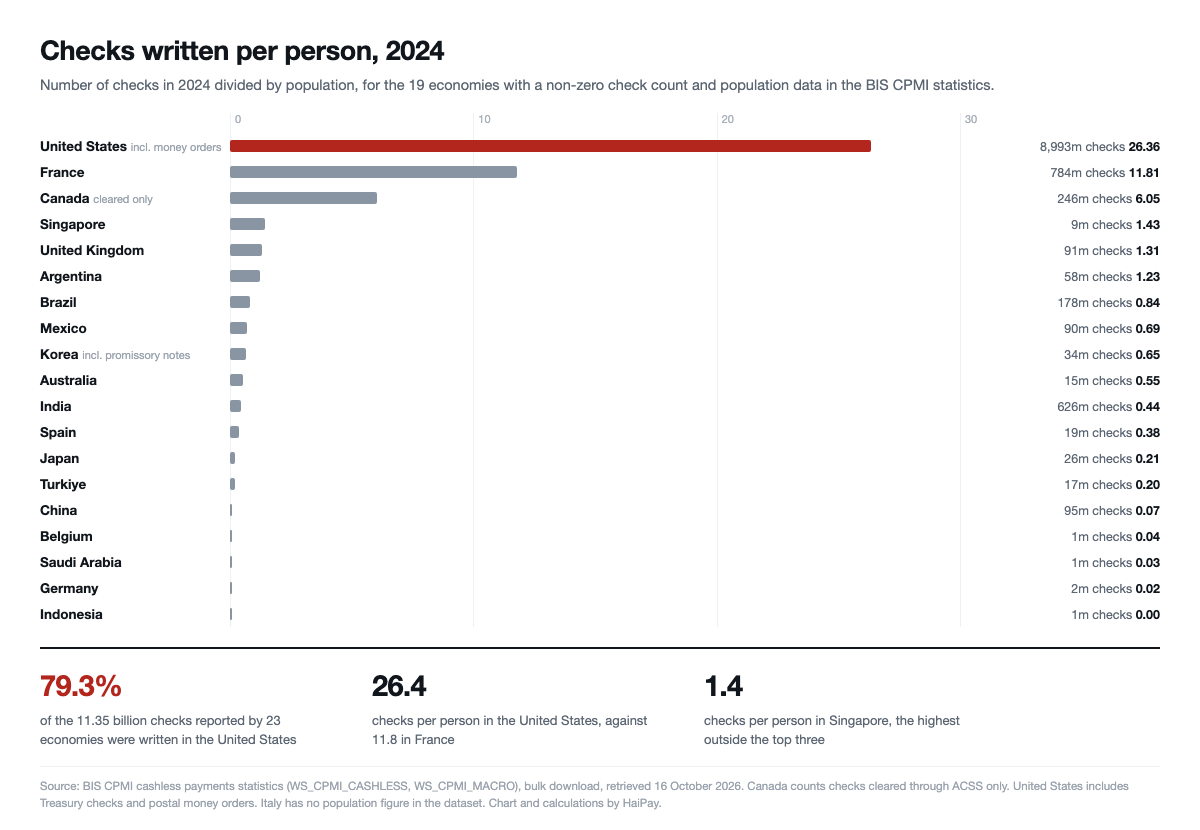
- Americans wrote 26.4 checks per person in 2024, against 11.8 in France and 6.0 in Canada; most others wrote fewer than one.
- US check numbers fell 29.6% from 2019 to 2024, against a median fall of 56.8% across 22 economies.
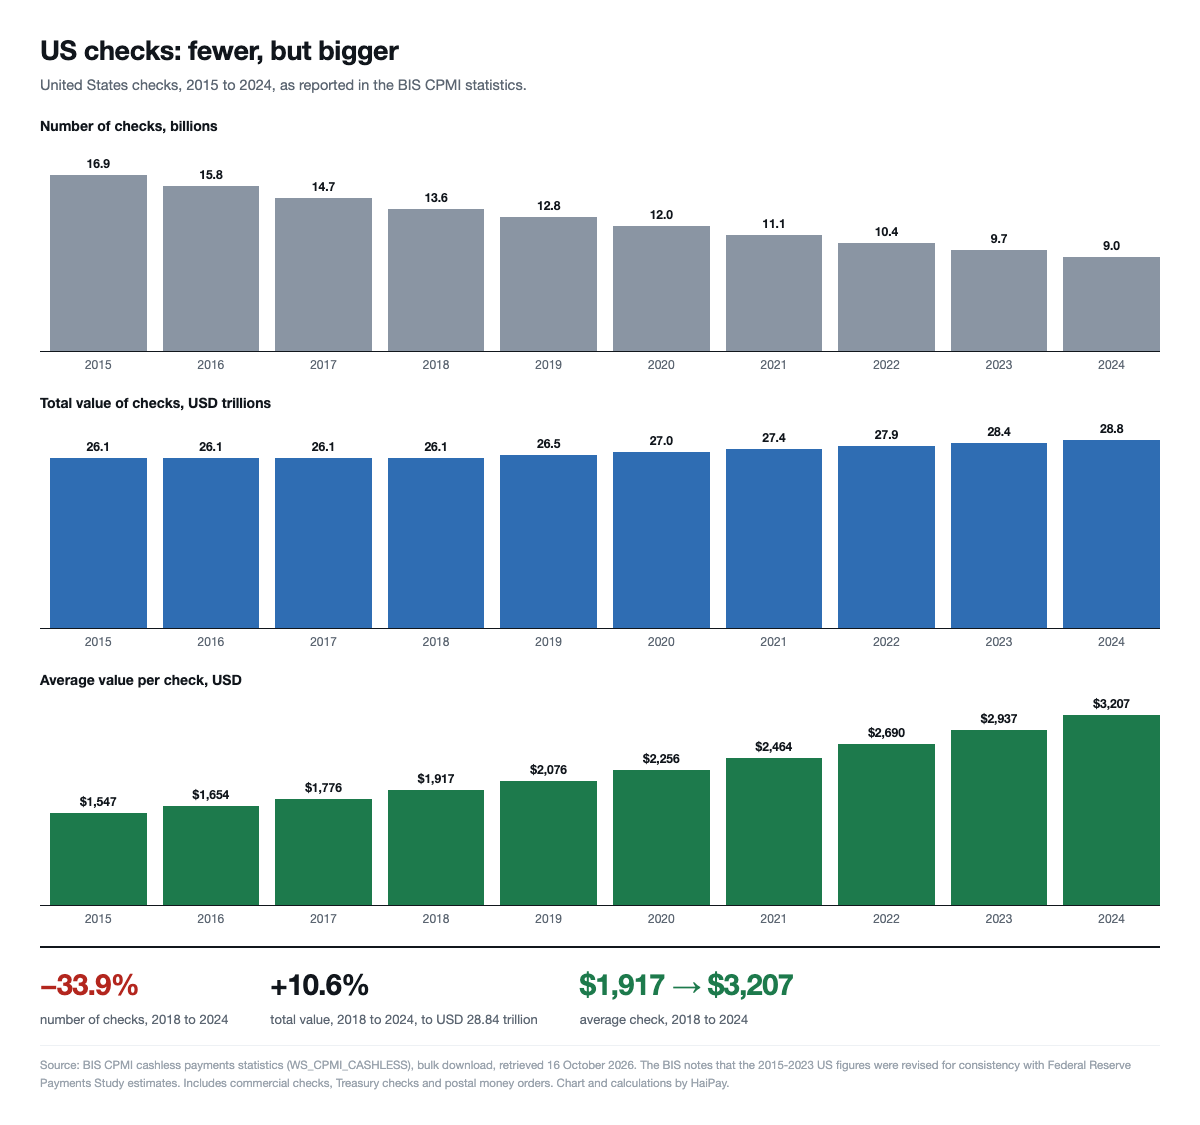
- From 2018 to 2024 the number of US checks fell 33.9% but their total value rose 10.6% to $28.84 trillion.
- The average US check rose from $1,917 to $3,207; in France it stayed at about EUR 500.
- Coverage differs by economy and the data do not show who writes checks or why amounts rose.
Americans wrote 8.99 billion checks in 2024, according to payment statistics published through the Bank for International Settlements. Across the 23 economies that report check numbers, that is 79.3% of the total.
The next largest check writer, France, wrote 784 million. India wrote 626 million and Canada 246 million. No other economy reached 200 million.
26 checks per person
Measured per person, the gap is just as wide. The United States wrote 26.4 checks for every resident in 2024. France wrote 11.8 and Canada 6.0.
After those three, the figures drop below two. Singapore wrote 1.4 checks per person, the United Kingdom 1.3 and Argentina 1.2. Germany wrote 0.02. The Netherlands, Sweden and South Africa report zero or close to zero.
Checks are still 4.1% of all cashless payments in the United States by number. In France they are 2.4%.
Falling, but more slowly
US check use is declining. Between 2019 and 2024 the number of checks fell 29.6%.
Almost everywhere else, it fell faster. Across the 22 economies with figures for both years, the median fall was 56.8%. Checks fell 50.6% in France, 66.5% in the United Kingdom, 73.6% in Australia and 81.2% in Singapore. Turkiye was the only economy where the number rose, by 1.8%.
Fewer checks, larger amounts
The total value of US checks has not fallen at all. Between 2018 and 2024 the number of checks dropped 33.9%, from 13.6 billion to 9.0 billion. Their combined value rose 10.6%, from $26.08 trillion to $28.84 trillion.
That means the average US check grew from $1,917 to $3,207, an increase of 67.3%. In France, by contrast, the average check was about EUR 500 in both 2019 and 2024.
Why this matters
For payment providers, the US figures describe a market where paper is shrinking at the small end but holding on at the large end. Consumers have moved everyday payments to cards and apps; the checks that remain carry much larger sums, a pattern consistent with business and government payments, though the data cannot show who writes them.
That makes US check volume less a consumer habit than a receivables problem. Any provider offering US payouts or invoice collection still has to handle a payment type that has shrunk far faster in most other large economies.
What this is not
Coverage differs between economies. The US figure includes Treasury checks and postal money orders. Canada counts only checks cleared between institutions. Korea includes promissory notes. The US share is a measure of scale, not an exact figure.
The BIS notes that the US figures for 2015 to 2023 were revised to match estimates from the Federal Reserve Payments Study, so the years between those estimates are estimates too. This article does not use the 2014 US figures, which fall outside that revision.
The statistics do not say who writes checks or why the average value rose. HaiPay did not contact the BIS or the Federal Reserve.
What to watch
Whether the US decline speeds up. At 29.6% over five years, it is about half the median pace.
Whether the average US check keeps rising. If the number keeps falling while total value holds, checks are becoming a high-value business instrument rather than an everyday one.
And whether France, the second-largest check user, keeps closing the gap with the rest of Europe, where check use per person is far lower.
Data highlight
79.3 %
Share of the 11.35 billion checks reported by 23 economies in the BIS CPMI statistics for 2024 that were written in the United States
2024, with changes from 2018 and 2019
Read the methodology and limitations
Data as of 16 October 2026 · UTC
Methodology and limitations
Compiled by HaiPay on 16 October 2026 from the statistics on payments and financial market infrastructures that the Committee on Payments and Market Infrastructures publishes through the Bank for International Settlements, downloaded as the bulk files WS_CPMI_CASHLESS and WS_CPMI_MACRO from data.bis.org. Checks are the annual number and value of cheque payments reported for each economy, all payment speeds, all directions. 23 economies report a check count for 2024, totalling 11,345.7 million. The Netherlands, Sweden and South Africa report zero, or a figure that rounds to zero, for 2024. Coverage differs: the United States figure includes commercial checks, US Treasury checks and postal money orders, and the BIS notes that its 2015 to 2023 figures were revised for consistency with estimates from the Federal Reserve Payments Study; Canada counts checks cleared through the Automated Clearing Settlement System and excludes checks drawn and deposited at the same institution; Korea includes promissory notes and cashier’s checks; Japan counts all items handled by its bill and cheque clearing systems. In 2024 the United States wrote 8,993.0 million checks, 79.3 per cent of the 23-economy total, followed by France with 783.8 million, 6.9 per cent, India with 625.9 million, 5.5 per cent, and Canada with 246.3 million, 2.2 per cent. Per person, using population from the macro file, the United States wrote 26.36 checks in 2024, France 11.81, Canada 6.05, Singapore 1.43, the United Kingdom 1.31 and Argentina 1.23; every other economy with population data wrote fewer than one, down to 0.02 in Germany. Checks were 4.1 per cent of all cashless payments by number in the United States and 2.4 per cent in France. Between 2019 and 2024 the number of checks fell in 21 of the 22 economies with values in both years, by a median of 56.8 per cent; it fell 29.6 per cent in the United States, 50.6 per cent in France, 66.5 per cent in the United Kingdom, 73.6 per cent in Australia, 76.0 per cent in Germany and 81.2 per cent in Singapore, and rose 1.8 per cent in Turkiye. In the United States, between 2018 and 2024, the number of checks fell from 13,602.9 million to 8,993.0 million, or 33.9 per cent, while their total value rose from USD 26.08 trillion to USD 28.84 trillion, or 10.6 per cent, so the average value per check rose from USD 1,917 to USD 3,207, or 67.3 per cent; in 2019 it was USD 2,076. In France the average check was EUR 513 in 2019 and EUR 500 in 2024. Every share, ratio, change and average is HaiPay’s arithmetic on the published values; 2014 US values are not used because the BIS revision covers 2015 to 2023 only. Three limits apply. Coverage differs between economies, as described above, so the United States share indicates scale rather than an exact figure. The United States values between Federal Reserve survey estimates are themselves estimates. And the statistics do not split checks by who writes them, so they cannot show whether the rise in the average value reflects business payments, government payments or fewer small consumer checks. HaiPay did not contact the BIS or the Federal Reserve.
Data note
HaiPay calculation from the BIS CPMI bulk files WS_CPMI_CASHLESS and WS_CPMI_MACRO, downloaded from data.bis.org on 16 October 2026. 23 economies report a check count for 2024, totalling 11,345.7 million; the United States wrote 8,993.0 million, or 79.3 per cent, and 26.36 checks per person. Between 2019 and 2024 US checks fell 29.6 per cent, against a median fall of 56.8 per cent across 22 economies.
Between 2018 and 2024 the number of US checks fell 33.9 per cent while their total value rose 10.6 per cent to USD 28.84 trillion, lifting the average check from USD 1,917 to USD 3,207. The US figure includes Treasury checks and postal money orders, and the BIS revised the 2015 to 2023 US figures to match Federal Reserve Payments Study estimates. Canada counts cleared checks only and Korea includes promissory notes, so cross-country shares indicate scale rather than exact figures. The data do not show who writes checks.
Data and research materials
- Checks by economy, 2019 and 2024 (BIS CPMI, HaiPay calculations) ↓CSV · 2 KB
- United States checks: number, value and average value, 2015-2024 ↓CSV · 1 KB
HaiPay’s charts and the two CSV tables on this page may be reused with attribution to HaiPay and a link to this article. The underlying statistics are published by the Bank for International Settlements; reuse of the source data is governed by the BIS terms of use, not by HaiPay.
Term definition
- Check
- A written order from an account holder instructing their bank to pay a stated sum to a named payee. Spelled cheque outside the United States. Americans wrote 8.99 billion in 2024.
- Average check value
- The total value of checks divided by their number. In the United States it rose from USD 1,917 in 2018 to USD 3,207 in 2024.
- Federal Reserve Payments Study
- A periodic survey by the US Federal Reserve that estimates the number and value of noncash payments in the United States. The BIS revised its 2015 to 2023 US check figures to match it.
4 sources
- Bank for International Settlements
CPMI cashless payments statistics (WS_CPMI_CASHLESS), bulk download
Annual number and value of checks for each economy, and all cashless payments for the United States and France. Source of every check count, share, change and average value in this article.
Accessed 16 October 2026 · UTC
- Bank for International Settlements
CPMI macro statistics (WS_CPMI_MACRO), bulk download
Population for each economy, used only to calculate checks per person.
Accessed 16 October 2026 · UTC
- Bank for International Settlements
The BIS presentation of the same CPMI statistics, for readers who want to browse the tables rather than download the files.
Accessed 16 October 2026 · UTC
- Bank for International Settlements
Index page listing the BIS bulk files, including the two used here.
Accessed 16 October 2026 · UTC
How to cite
HaiPay News, "Americans Wrote 9 Billion Checks in 2024: 79% of the Total", https://www.haipay.net/news/us-checks-79-percent-of-cpmi-total, 16 October 2026