NewsLocal Payments
ATM Withdrawals Fell in 21 of 23 Economies. Cash Still Grew
Across 23 economies in BIS payment statistics, the number of ATM cash withdrawals fell in 21 between 2019 and 2024, a median fall of 27.3%. Over the same years, banknotes and coins in circulation rose in 18 of 20 currency areas.
Key takeaways 6
- ATM cash withdrawals fell in 21 of 23 economies in BIS payment statistics between 2019 and 2024, a median fall of 27.3%.
- China’s withdrawals fell 60.2%, the UK’s 53.5% and the US’s 43.8%; only South Africa and Turkiye rose.
- Banknotes and coins in circulation rose in 18 of 20 currency areas; US cash grew 31.4% to $2.37 trillion.
- Relative to GDP, cash fell in 14 of the 20 and rose in six, led by Mexico from 6.77% to 9.31%.
- Japan holds the most cash relative to GDP at 21.17%; Sweden the least at 0.89%, after falls on both measures.
- Withdrawal series differ in coverage between economies, so each is compared only with its own past.
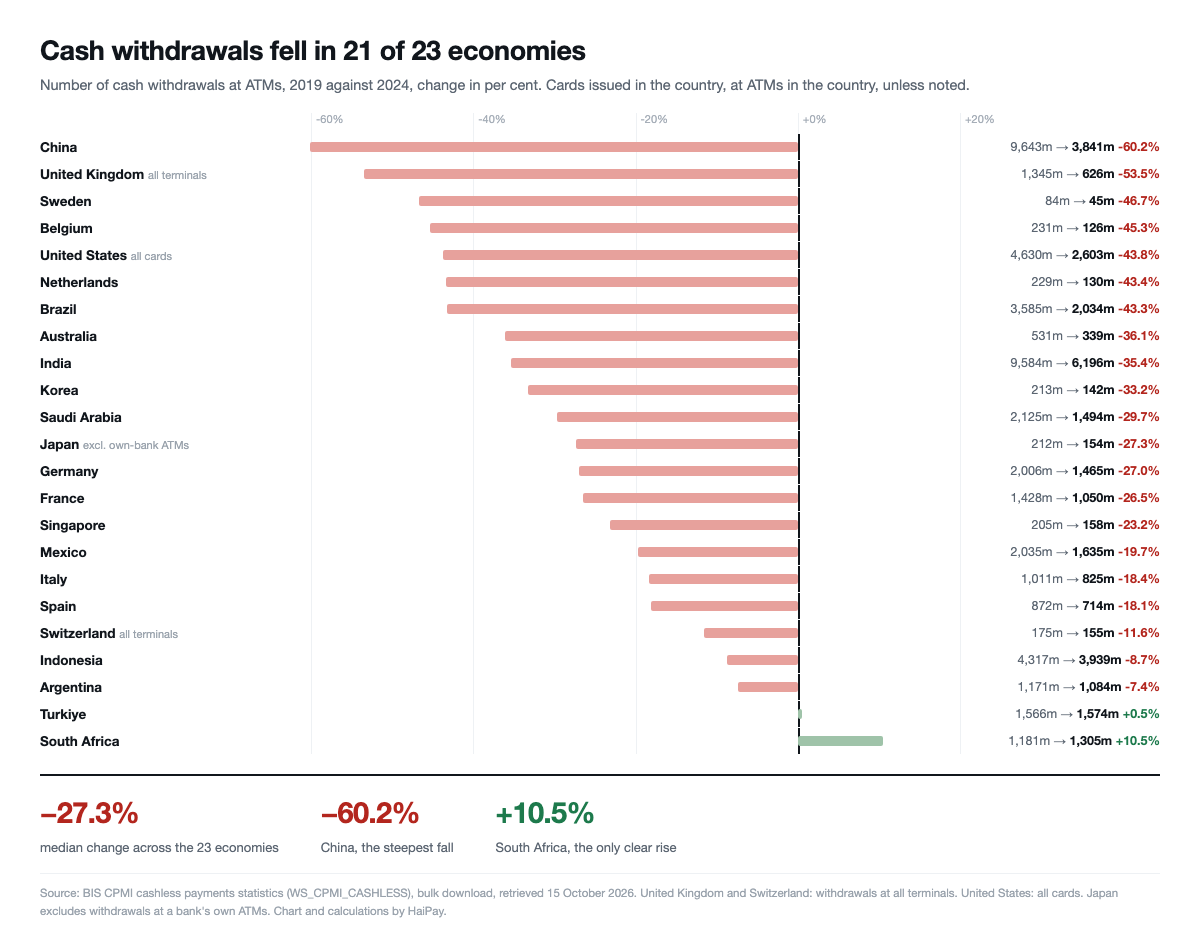
Across 23 economies in the Bank for International Settlements’ payment statistics, the number of cash withdrawals at ATMs fell in 21 between 2019 and 2024. The median change was minus 27.3%.
Over the same years, the amount of cash in circulation rose in 18 of 20 currency areas.
People are taking cash out of machines far less often. Yet more cash is outstanding than before.
Fewer trips to the machine
China recorded the steepest fall in the data, from 9.64 billion withdrawals in 2019 to 3.84 billion in 2024, down 60.2%. Withdrawals fell 53.5% in the United Kingdom, 46.7% in Sweden and 45.3% in Belgium.
In the United States they fell from 4.63 billion to 2.60 billion, down 43.8%. Brazil fell 43.3%, India 35.4% and Korea 33.2%.
Only two economies went the other way. Withdrawals in South Africa rose 10.5%, from 1.18 billion to 1.31 billion. Turkiye was flat, up 0.5%.
More cash outstanding
Banknotes and coins in circulation in the United States rose from $1.80 trillion to $2.37 trillion, an increase of 31.4%. In the euro area they rose 22.7%, from EUR 1.33 trillion to EUR 1.63 trillion.
The increases were larger in several emerging markets: 89.1% in Mexico, 60.9% in China, 53.7% in Korea, 52.2% in India and 51.8% in Indonesia.
Sweden and Switzerland were the exceptions. Cash in circulation fell 10.1% in Sweden and 11.7% in Switzerland.
Of the 17 economies with both measures in the data, 13 recorded fewer withdrawals and more cash in circulation.
Relative to the economy, a split
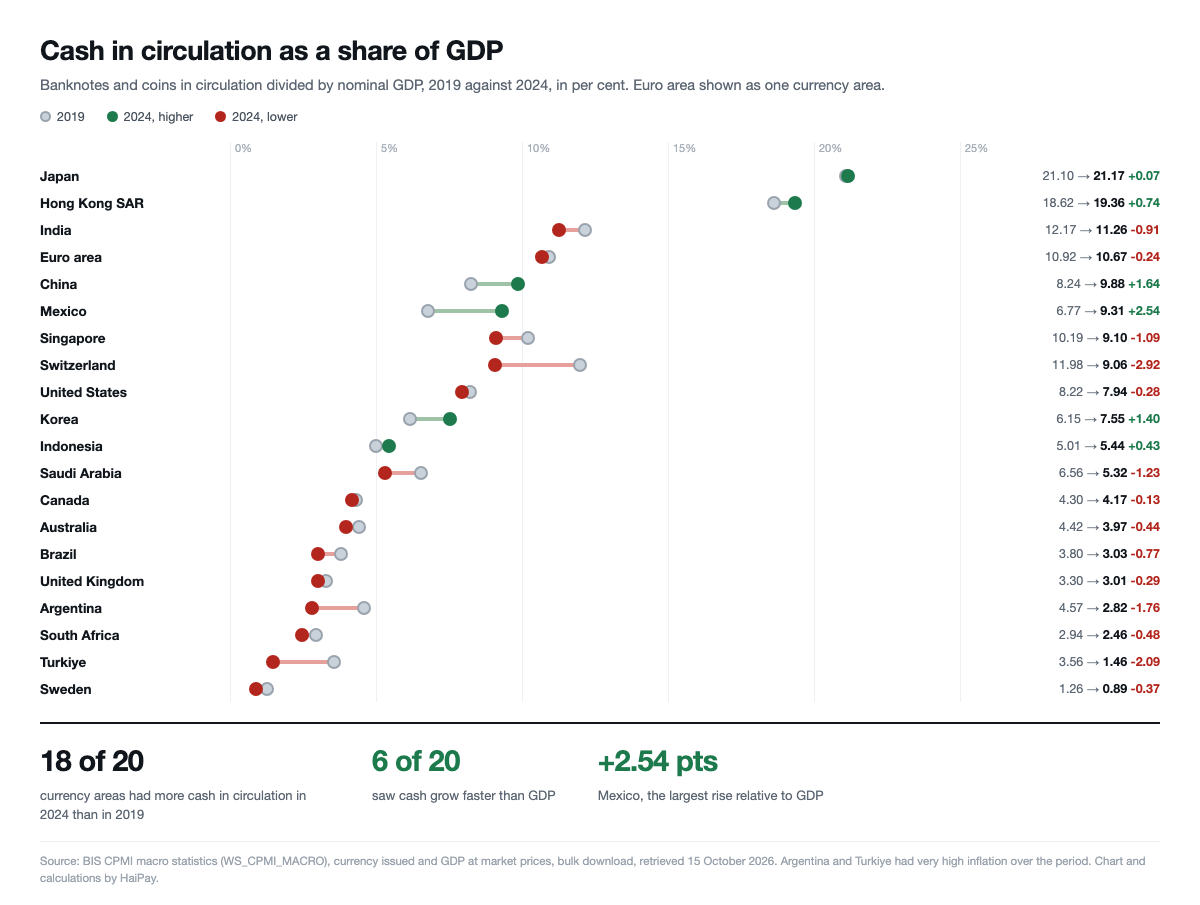
Most of that growth is not growth relative to the size of the economy. Measured against GDP, cash in circulation fell in 14 of the 20 currency areas.
It rose in six. Mexico had the largest increase, from 6.77% of GDP to 9.31%, followed by China, from 8.24% to 9.88%, and Korea, from 6.15% to 7.55%. Hong Kong SAR, Indonesia and Japan also rose. Japan holds the most cash relative to its economy, at 21.17% of GDP. Sweden holds the least, at 0.89%.
Why this matters
For payment providers, the falling withdrawal count is the clearer signal. It tracks how often people reach for cash, and in most of these economies that has dropped by a quarter or more in five years. The shift is to cards, wallets and instant account-to-account payments.
The growing stock of cash points the other way, but it is not a measure of payments. In Mexico, China and Korea, cash grew faster than the economy even as people withdrew it less often. That combination suggests notes are being held rather than spent, though these statistics cannot show it directly.
What this is not
The withdrawal series do not measure the same thing in every economy. The United Kingdom and Switzerland report withdrawals at all terminals, the United States counts all cards, and Japan’s figure excludes withdrawals at a bank’s own ATMs. This article compares each economy only with itself.
The United States figures for 2019 to 2021 fall by exactly the same amount each year, which indicates they are estimated between surveys. The US change is approximate.
Argentina and Turkiye had very high inflation over the period, so their large nominal increases in cash say little.
Cash in circulation includes notes held abroad and notes kept as savings. The data cannot separate those from cash used to pay, and nothing here shows why cash grew. HaiPay did not contact the BIS or any central bank.
What to watch
Whether the cash-to-GDP ratio in Mexico, China and Korea keeps rising as withdrawals fall. If it does, holding cash, not spending it, is the trend to explain.
Whether South Africa’s withdrawals keep growing. It is the only economy in the data where they did.
And whether Sweden’s ratio, already below 1% of GDP, keeps falling. Sweden and Switzerland are the only economies in the data where cash fell on both measures.
Data highlight
-27.3 %
Median change in the number of ATM cash withdrawals across 23 economies in the BIS CPMI statistics from 2019 to 2024, while banknotes and coins in circulation rose in 18 of 20 currency areas
2019 to 2024
Read the methodology and limitations
Methodology and limitations
Compiled by HaiPay on 15 October 2026 from the statistics on payments and financial market infrastructures that the Committee on Payments and Market Infrastructures publishes through the Bank for International Settlements, downloaded as the two bulk files WS_CPMI_CASHLESS and WS_CPMI_MACRO from data.bis.org. Cash withdrawals are the annual number of cash withdrawals at ATMs, using for each economy the series for cards issued in the country at ATMs located in the country.
Where that series is not available for both years, the closest available series is used and labelled: for the United States, withdrawals with all cards at ATMs in the country; for the United Kingdom and Switzerland, withdrawals at all terminals rather than at ATMs only. Japan’s series excludes withdrawals made at a bank’s own ATMs. 23 economies have a withdrawal value for both 2019 and 2024; Canada and Russia do not and are excluded.
Cash in circulation is the series for total banknotes and coins in circulation, in local currency, divided where stated by GDP at market prices. Euro area currency is reported for the euro area as a whole, so the euro area is one of the 20 currency areas with values for both years, while Belgium, France, Germany, Italy, the Netherlands and Spain appear in the withdrawal comparison only. Russia has no 2024 value and is excluded.
Between 2019 and 2024 cash withdrawals fell in 21 of the 23 economies, with a median change of minus 27.3 per cent.
The largest falls are China, from 9,643 million to 3,841 million, minus 60.2 per cent; the United Kingdom, from 1,345 million to 626 million, minus 53.5; Sweden, from 84 million to 45 million, minus 46.7; Belgium, from 231 million to 126 million, minus 45.3; the United States, from 4,630 million to 2,603 million, minus 43.8; the Netherlands, from 229 million to 130 million, minus 43.4; and Brazil, from 3,585 million to 2,034 million, minus 43.3.
Withdrawals rose in South Africa, from 1,181 million to 1,305 million, plus 10.5 per cent, and in Turkiye, from 1,566 million to 1,574 million, plus 0.5. Banknotes and coins in circulation rose in 18 of the 20 currency areas and fell in Sweden, by 10.1 per cent, and Switzerland, by 11.7 per cent.
In the United States they rose from USD 1.80 trillion to USD 2.37 trillion, or 31.4 per cent; in the euro area from EUR 1.33 trillion to EUR 1.63 trillion, or 22.7 per cent; in Mexico by 89.1 per cent; in China by 60.9; in Korea by 53.7; in India by 52.2; and in Indonesia by 51.8.
Relative to GDP, cash in circulation rose in 6 of the 20 currency areas: Mexico, from 6.77 to 9.31 per cent of GDP; China, from 8.24 to 9.88; Korea, from 6.15 to 7.55; Hong Kong SAR, from 18.62 to 19.36; Indonesia, from 5.01 to 5.44; and Japan, from 21.10 to 21.17.
It fell in the other 14, most of all in Switzerland, from 11.98 to 9.06 per cent, Turkiye, from 3.56 to 1.46, and Argentina, from 4.57 to 2.82; Sweden had the lowest ratio in 2024, at 0.89 per cent, and Japan the highest, at 21.17. Of the 17 economies with both a national currency series and a withdrawal series, 13 recorded fewer withdrawals and more cash in circulation. Every percentage change, ratio, median and count is HaiPay’s arithmetic on the published values. Four limits apply.
The withdrawal series differ in coverage between economies, as described above, so levels should not be compared across economies; only each economy’s own change is used. The United States values for 2019, 2020 and 2021 fall by an identical amount each year, which indicates that the reported figures are estimated between survey years, so the United States change should be read as approximate. Argentina and Turkiye experienced very high inflation over the period, so their changes in nominal cash in circulation carry little information.
And cash in circulation includes notes held abroad and notes held as savings, which these statistics cannot separate from cash used for payments, so the data do not show why cash grew. HaiPay did not contact the BIS or any central bank.
Term definition
- Currency in circulation
- The value of banknotes and coins issued by a central bank and held outside it. In the United States it rose from USD 1.80 trillion in 2019 to USD 2.37 trillion in 2024.
- CPMI
- The Committee on Payments and Market Infrastructures, a standard-setting body hosted by the Bank for International Settlements, which publishes comparable payment statistics for its member economies.
- Cash-to-GDP ratio
- Cash in circulation divided by the value of an economy’s annual output. It shows whether cash is growing faster or slower than the economy; it rose in 6 of 20 currency areas.
4 sources
- Bank for International Settlements
CPMI cashless payments statistics (WS_CPMI_CASHLESS), bulk download
- Bank for International Settlements
- Bank for International Settlements
- Bank for International Settlements
How to cite
HaiPay News, "ATM Withdrawals Fell in 21 of 23 Economies. Cash Still Grew", https://www.haipay.net/news/atm-withdrawals-fall-cash-in-circulation-rises, 15 October 2026