NewsRegulation
UPI Hit 24.51 Billion. Average Payment Fell to ₹1,217.
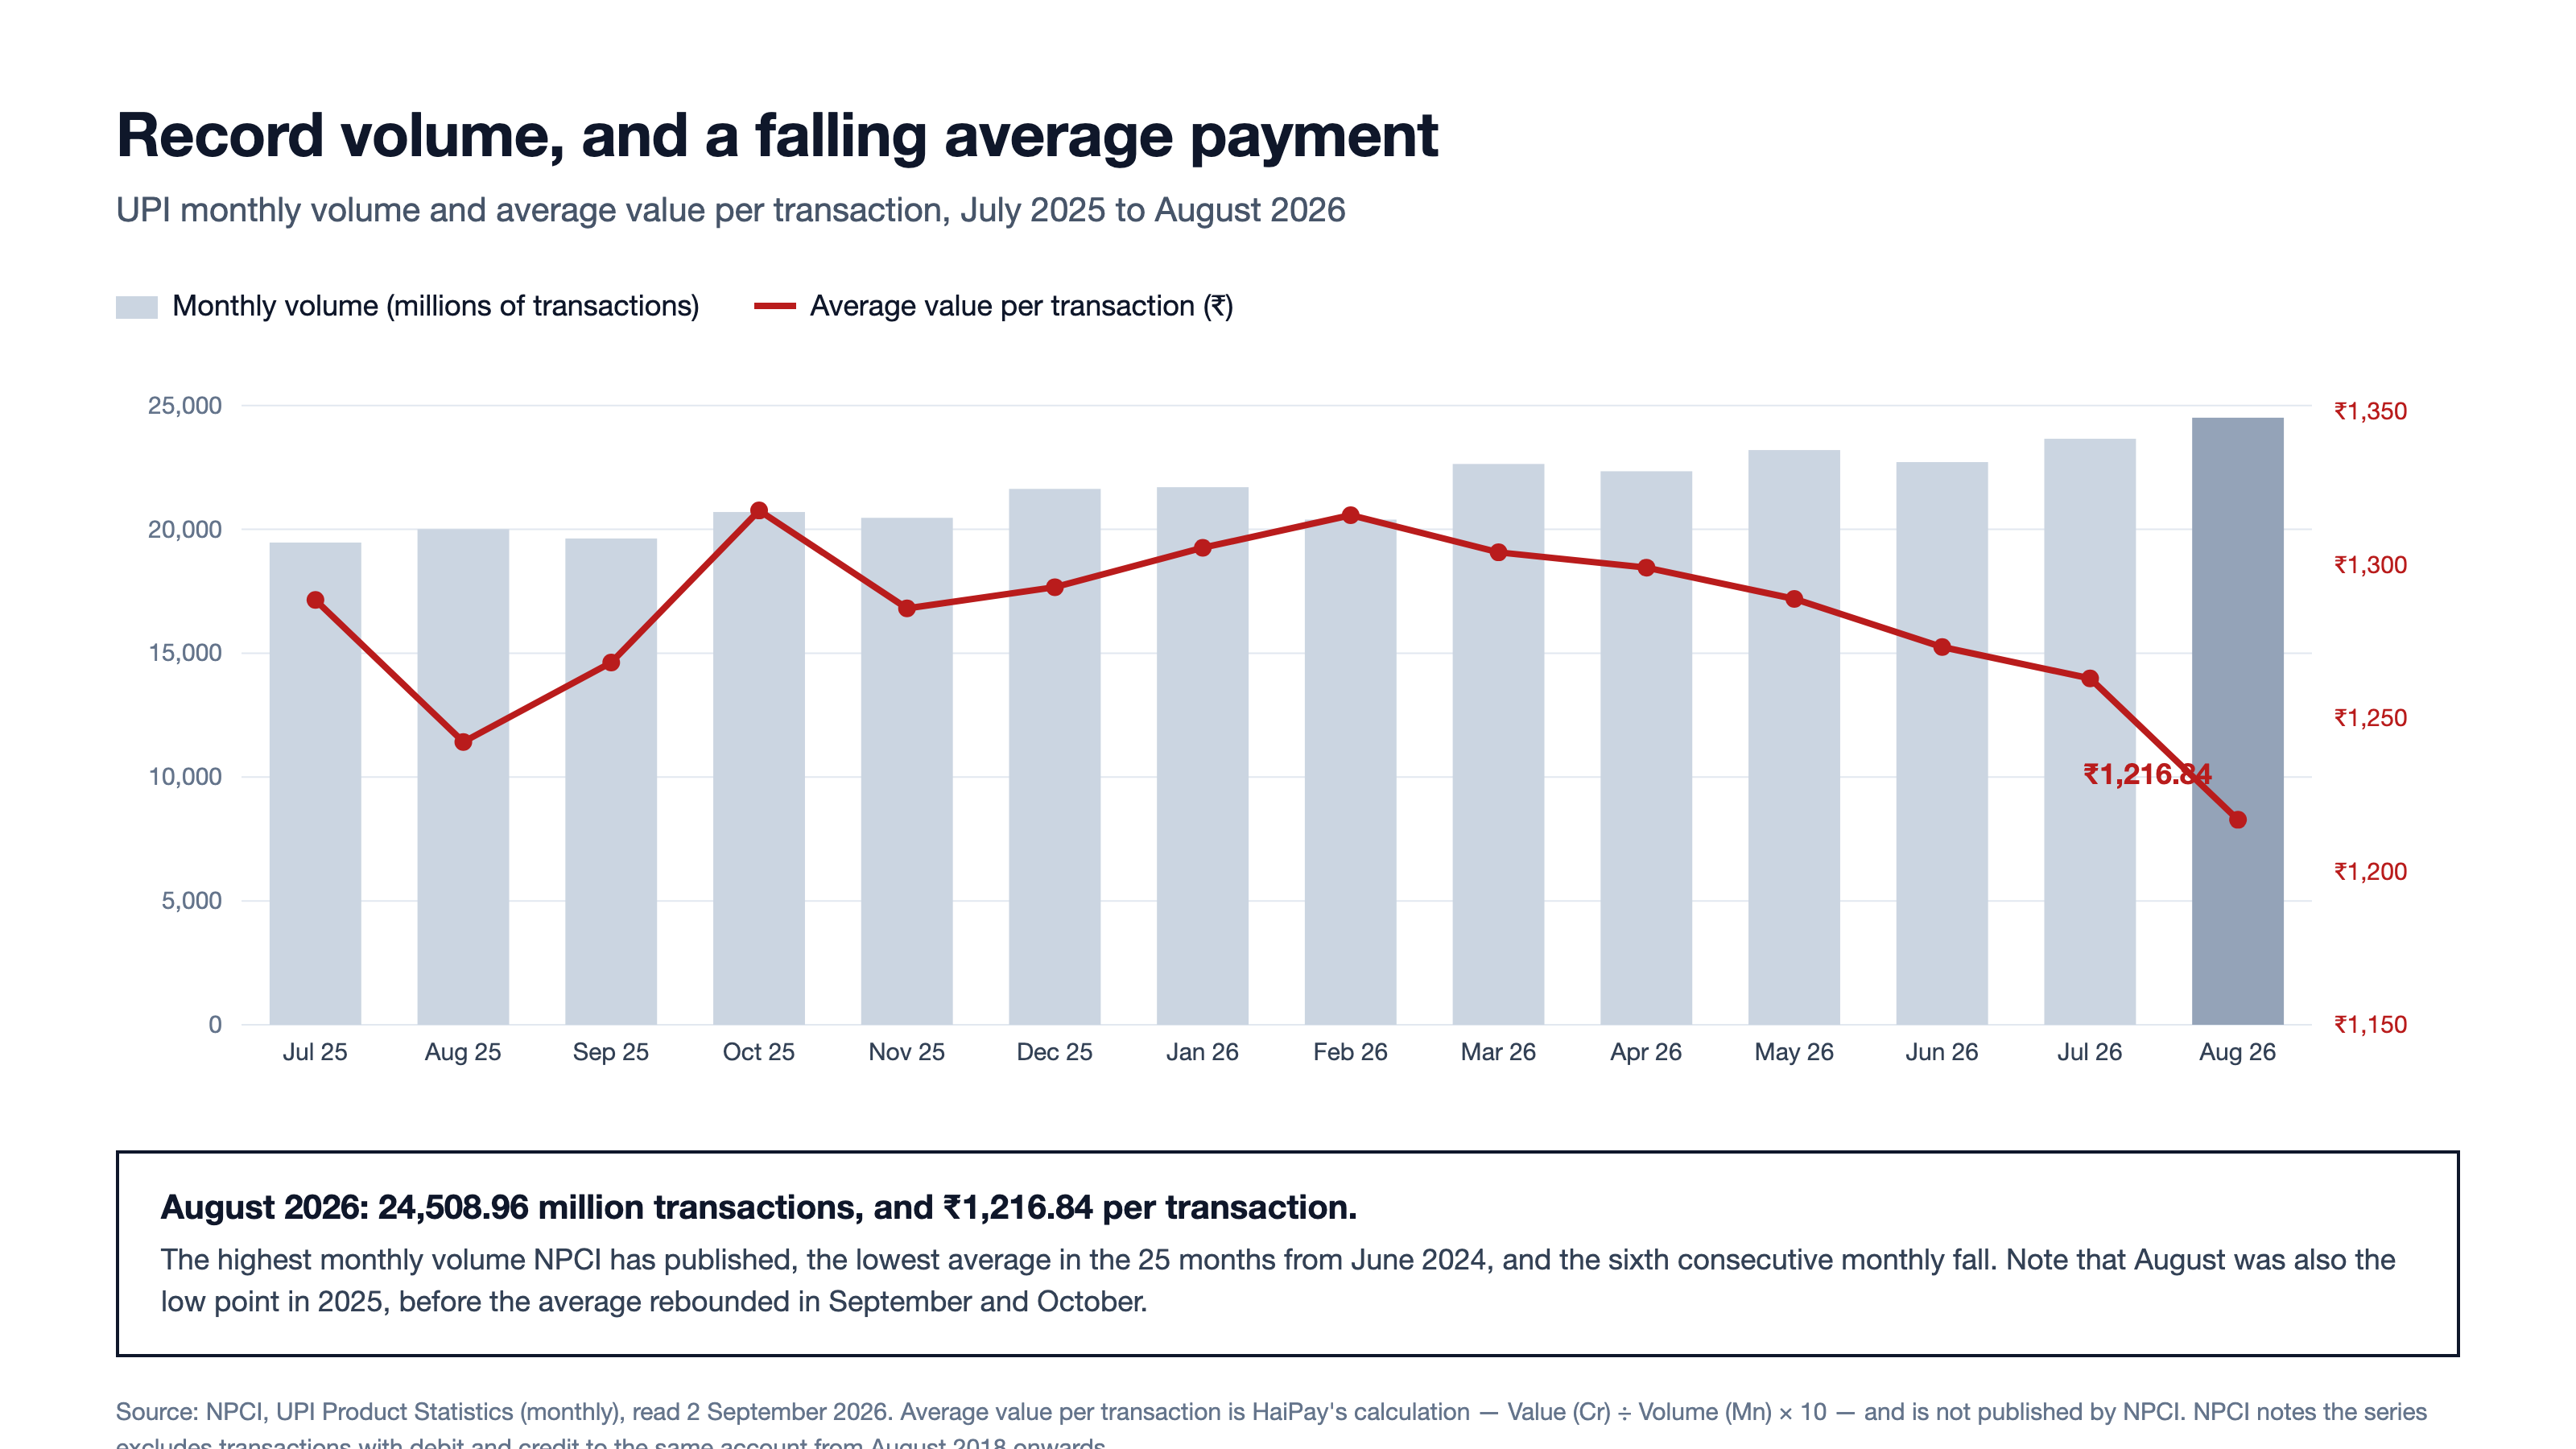
India's instant payment rail set a volume record in August. Its total value did not. UPI processed 24,508.96 million transactions worth ₹29,82,355.95 crore, and the average payment behind those two numbers fell to ₹1,216.84 — the sixth monthly decline in a row, and a steeper one-month drop than the whole of the past year.
Key takeaways 6
- NPCI put UPI at 24,508.96 million transactions in August 2026, the highest monthly volume it publishes, on 752 live banks.
- Total value fell 0.18% while volume rose 3.60%, so the average payment dropped 3.65% to ₹1,216.84.
- The average has now fallen for six months, but it also fell from June to August in 2025 before rebounding.
- The merchant-mix explanation fails: on July's split, the P2M share of volume fell and P2P volume grew faster.
- The whole year-on-year decline sits inside P2P, where the average payment fell from ₹2,506.39 to ₹2,395.98.
- NPCI had not published the August P2P/P2M, app-wise or state-wise tables when this was written on 2 September.
India's instant payment rail set a volume record in August. Its total value did not.
NPCI's monthly table, read on 2 September, puts UPI at 24,508.96 million transactions worth ₹29,82,355.95 crore, the highest transaction count it publishes, on a total value 0.18% below July's. Divide one by the other and the average payment comes to ₹1,216.84 — the sixth consecutive monthly fall, and the smallest figure in the 25 months of the series HaiPay checked.
For readers who do not work in Indian units: ₹29,82,355.95 crore is ₹29.82 trillion, and 24,508.96 million transactions across a 31-day month averages about 9,151 transactions every second, day and night. UPI is not a niche rail having a good month. The interesting part is that a system at that scale moved its average payment by 3.65% in four weeks.
Two numbers, opposite directions
Volume rose 3.60% on July. Value fell 0.18%. Those two facts are arithmetically the same statement as "the average payment fell 3.65%, from ₹1,262.93 to ₹1,216.84" — but only the first version tends to get published, and only the second says what changed.
Year on year the same gap is there and smaller. Against August 2025, volume is up 22.49% and value up 19.99%, so the average is down 2.04%. The single month-on-month step was nearly twice the whole year's move.
The longer view is steeper. In June 2026 the average was ₹1,273.17; in June 2025, ₹1,306.84; in June 2024, ₹1,445.49. Over those 26 months the average UPI payment has fallen 15.8% in nominal rupees, before any adjustment for inflation.
One caution belongs here rather than in a footnote. August was the low point last year too. The average fell from ₹1,306.84 in June 2025 to ₹1,242.22 in August 2025, a drop of 4.94%, and then rebounded to ₹1,268.11 in September and ₹1,317.71 in October. This year's June-to-August fall, 4.42%, is almost the same size. What is different is the length of the run — six months rather than three, back to March — and the level: ₹1,216.84 is 2.04% below last August's trough. A reader treating six consecutive declines as a trend should wait for September, because last year September ended the run.
Two things went the other way. Banks live on UPI reached 752, eleven more than in July and 47 more than in March. And the average value per transaction is the one number in this release that NPCI does not publish at all; it has to be derived.
The merchant-mix explanation does not survive the split
The standard explanation for a falling average is mix. Merchant payments are small, they grow faster than person-to-person transfers, so the blend drops. NPCI publishes the data to test that, in a second table splitting each month into P2P and P2M. It does not support the explanation.
August's split is not out yet. On the most recent month that has one — July 2026 — the P2M share of volume was 63.28%, down from 63.63% a year earlier. Person-to-person transactions grew faster over that year, up 22.7%, than merchant transactions, up 20.9%. The mix moved towards the larger-ticket segment, not away from it.
The average still fell over the same year, from ₹1,288.53 to ₹1,262.93. Splitting that ₹25.60 into a mix effect and a within-segment effect puts the mix at plus ₹6.69 — it pushed the average up — and the within-segment change at minus ₹32.29. Almost all of that is one line. The average P2P payment fell from ₹2,506.39 to ₹2,395.98, worth minus ₹40.54 on the blend. The average merchant payment moved the other way, from ₹592.51 to ₹605.55, worth plus ₹8.25.
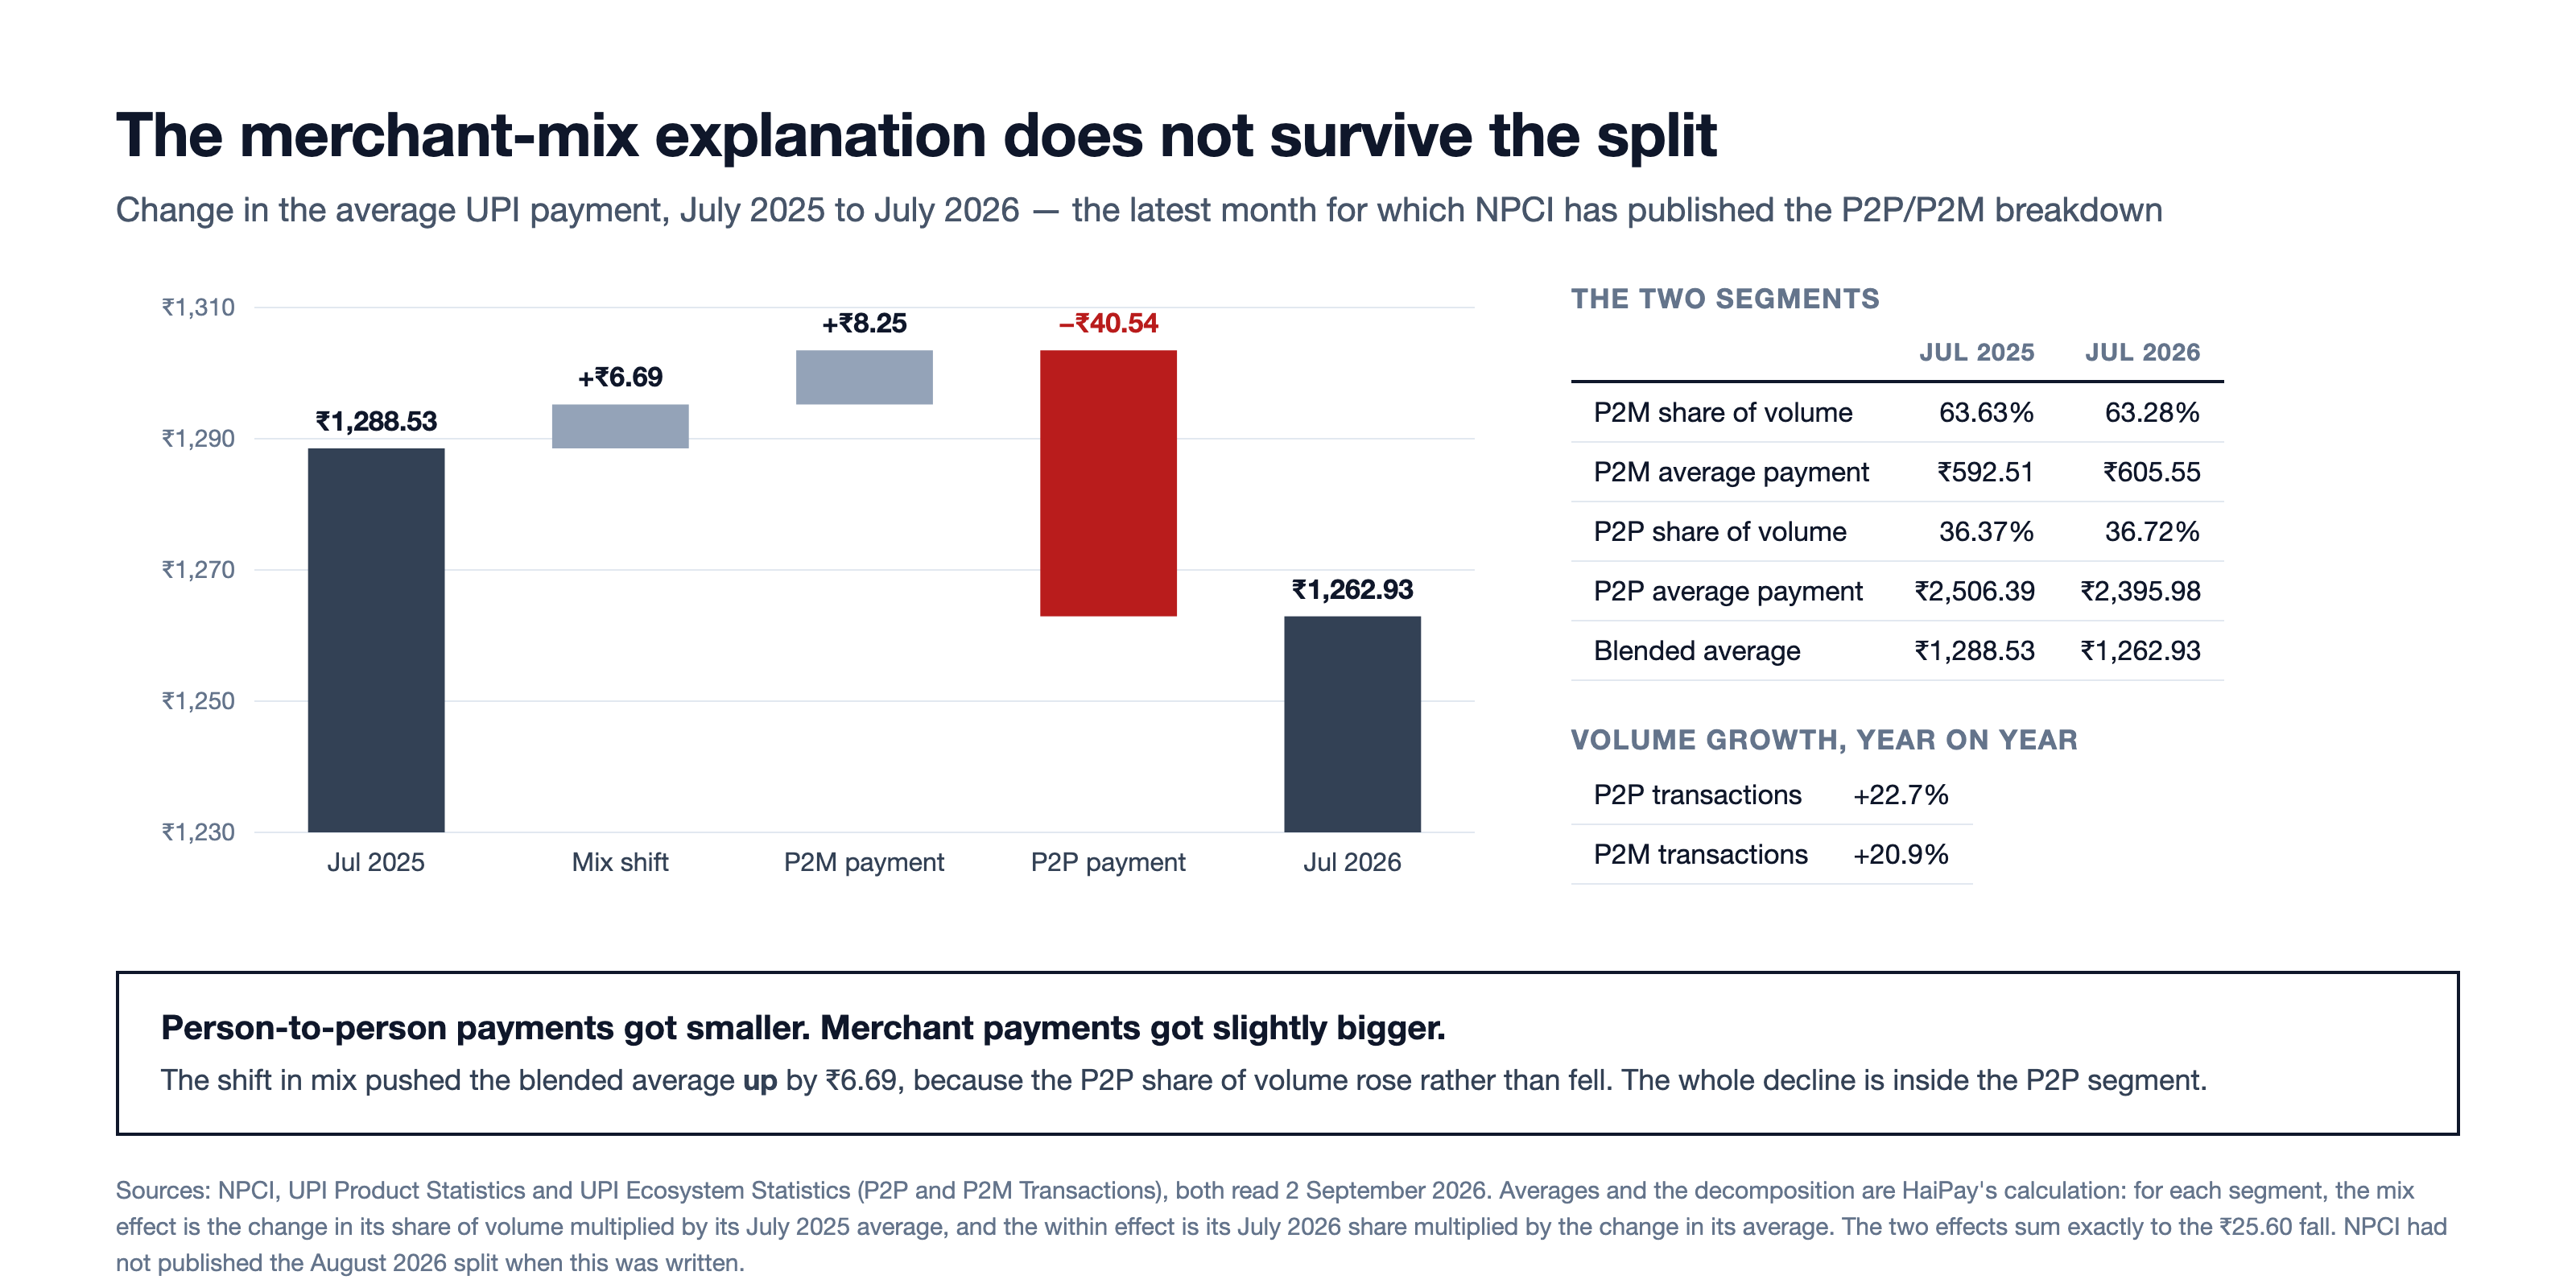
What is getting smaller, then, is the transfer between two people, not the payment to a shop. That is a different phenomenon from merchant adoption and it raises different questions: whether households are splitting the same transfers into more of them, whether a growing tail of very small P2P payments is displacing cash at the bottom end, or whether the composition of who sends has shifted. A two-column table cannot settle any of them.
What the daily average adds, and what it does not
The monthly totals divide out to 790.61 million transactions and ₹96,205 crore per day in August, against 763.17 million and ₹96,383 crore per day in July. Those daily figures are correct, and for this particular comparison they add nothing: July and August both have 31 days, so the daily change and the monthly change are identical to the decimal.
The daily framing earns its keep in months of different length. February 2026's monthly volume, 20,394.18 million, was below January's 21,703.44 million, while its daily average, 728.36 million, was well above January's 700.11 million. February shrank on the calendar, not in use. August did not have that excuse, and it did not need one.
What is not published, and what to watch
NPCI's monthly table carries a footnote worth reading before anyone quotes these figures: from August 2018 onwards the series excludes transactions where the debit and the credit are to the same account. It is a definitional choice, not a rounding one, and it applies to every number above.
The composition data lags the headline. Checked on 2 September, the UPI Applications, P2P and P2M, Top 15 PSPs, merchant-category and state-wise tables for August 2026 all returned "No data found". The aggregate arrives first; the tables that would explain it arrive later.
The average value per transaction is HaiPay's arithmetic on NPCI's two published columns, not an NPCI statistic. Anyone re-deriving it should use value in crore divided by volume in millions, multiplied by ten, and should expect small differences if NPCI restates a month.
For anyone sizing an India integration, the headline count is the least useful number in the release. Ticket size drives the per-transaction economics of everything built on top of the rail, and it is the field NPCI leaves to the reader to work out.
That leaves three dated things to watch. Whether the August split, when it lands, confirms that the fall is still concentrated in P2P. Whether September breaks the run, as it did in 2025. And whether total value falls for a second month: one month at minus 0.18% is noise, two is a series.
Data highlight
1216.84 Indian rupees per transaction
Average value per UPI transaction, derived from NPCI monthly volume and value
August 2026
Read the methodology and limitations
Methodology and limitations
Calculated by HaiPay from the two columns NPCI publishes in its UPI monthly statistics table, read on 2 September 2026: August 2026 volume of 24,508.96 million transactions and value of 29,82,355.95 crore rupees, giving value in crore divided by volume in millions multiplied by ten, or 1,216.84 rupees. NPCI does not publish an average value per transaction.
The same calculation gives 1,262.93 rupees for July 2026 and 1,242.22 rupees for August 2025, so the average fell 3.65 per cent month on month and 2.04 per cent year on year, and August 2026 was the sixth consecutive monthly decline. The same calculation shows the average also fell from 1,306.84 rupees in June 2025 to 1,242.22 rupees in August 2025 before rebounding to 1,268.11 rupees in September 2025, so part of the recent run may be seasonal.
NPCI states that from August 2018 onwards the series excludes transactions where the debit and the credit are to the same account, so the figure is an average over that reduced set. Volume and value are as published and may be restated by NPCI; HaiPay did not obtain transaction-level data.
Term definition
- Unified Payments Interface (UPI)
- India's instant account-to-account payment system, operated by the National Payments Corporation of India. A payer addresses money to a virtual payment address or a QR code rather than to account and branch numbers, and the transfer clears in seconds between banks. It is used both for transfers between individuals and for payments to merchants, and NPCI reports those two uses separately.
- P2P and P2M
- NPCI's two reporting categories for UPI. P2P covers payments from one person to another; P2M covers payments from a person to a merchant. The split matters because the two behave differently: merchant payments are far more numerous and far smaller, so a change in the ratio between them moves the average value of a UPI transaction without anything changing inside either category.
- Crore
- An Indian unit of counting equal to ten million. NPCI reports UPI value in crore of rupees, so 29,82,355.95 crore is 29.82 trillion rupees. Volume is reported separately in millions, which is why deriving an average value per transaction requires a factor of ten between the two columns.
3 sources
- National Payments Corporation of India
- National Payments Corporation of India
- National Payments Corporation of India
How to cite
HaiPay News, "UPI Hit 24.51 Billion. Average Payment Fell to ₹1,217.", https://www.haipay.net/news/upi-august-2026-record-volume-average-payment, 2 September 2026