NewsLocal Payments
dLocal Revenue per $100 of TPV Falls to $2.17 in Q3
dLocal's revenue per US$100 of total payment volume fell from US$2.72 to US$2.17 in Q3 2026, while operating profit equalled 41.5 cents per US$100, by HaiPay's calculation.

Key takeaways 6
- dLocal's TPV rose 76.6% year over year to US$18.345bn in Q3 2026.
- Revenue per US$100 of TPV fell from US$2.72 to US$2.17.
- Gross profit per US$100 of TPV declined from 99 cents to 72 cents.
- Operating expenses per US$100 of TPV fell from 45.8 cents to 30.4 cents.
- Operating profit per US$100 of TPV fell from 53.5 cents to 41.5 cents.
- Operating profit rose to 57.7% of gross profit, cushioning the compression.
dLocal processed US$18.345 billion in total payment volume in the third quarter of 2026, up 76.6% from US$10.390 billion a year earlier. Revenue increased 40.9% to US$398.049 million, while TPV grew faster, reducing revenue per US$100 of TPV from US$2.72 to US$2.17, by HaiPay's calculation.
The 55-cent decline, or 20.2%, shows that TPV and revenue grew at different rates. Separately, when discussing the sequential comparison with Q2 2026, dLocal said revenue was affected by a higher share of local-to-local and payout volume and by softer Argentina volume after the second-quarter Hot Sale peak. The company did not quantify how much each factor contributed to the year-over-year decline in revenue per US$100 of TPV.
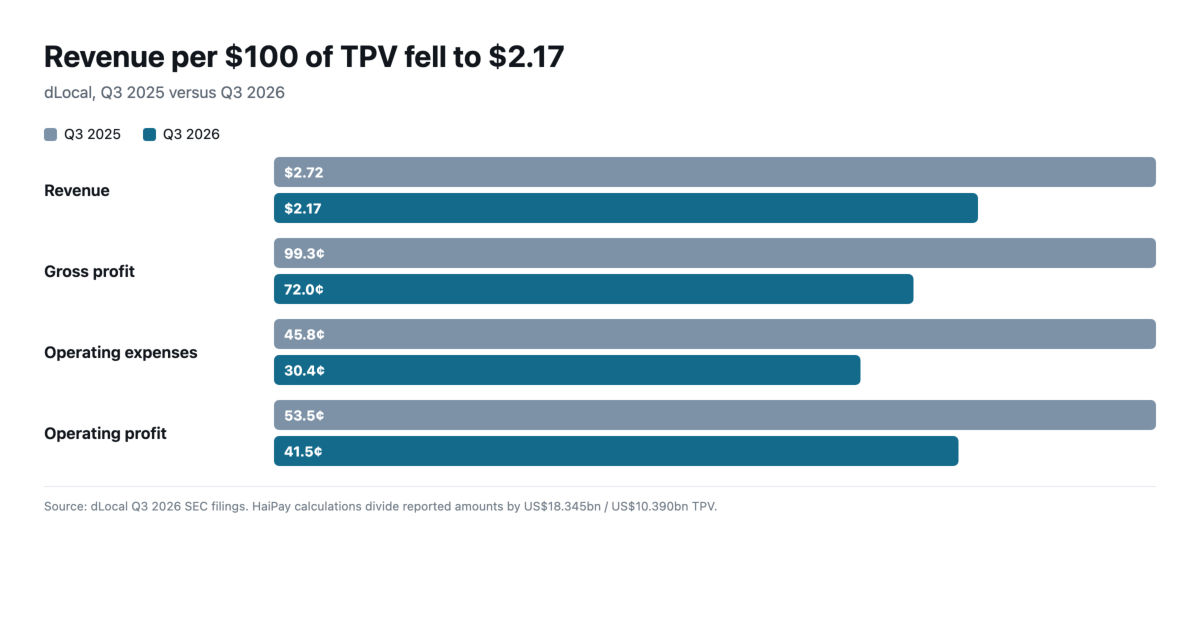
Gross profit fell to 72 cents per $100 processed
Gross profit rose 27.9% in dollars to US$132.0 million but fell from 99 cents to 72 cents per US$100 of TPV. dLocal itself reported gross profit over TPV at 0.72%, down from 0.99%. It attributed the movement to payment-method and geographic mix, scaling dynamics with merchants, and several market-specific cost effects.
Operating expenses rose 17.3% to US$55.9 million, slower than both TPV and gross profit. On HaiPay's ratio, operating expenses fell from 45.8 cents to 30.4 cents per US$100 of TPV. That left operating profit at 41.5 cents per US$100, down from 53.5 cents despite a 37.0% increase in total operating profit.
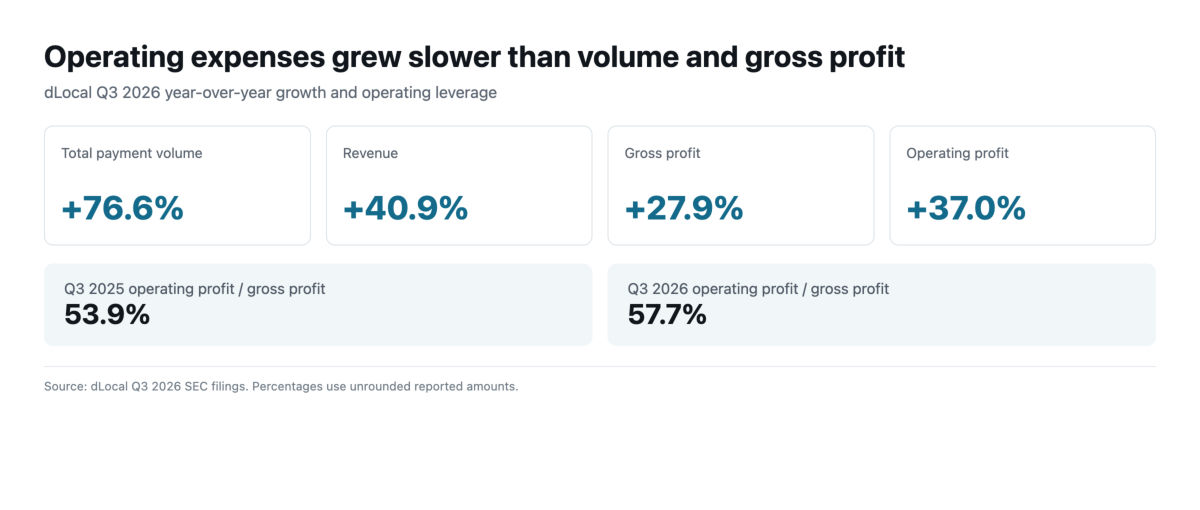
Operating expenses took a smaller share of gross profit
Operating profit equalled 57.7% of gross profit, up from 53.9% a year earlier. Arithmetically, operating expenses consumed 42.3 cents of each gross-profit dollar, down from 46.1 cents. dLocal attributed its sequential operating-expense decline to lower third-party spending, lower headcount and automation benefits.
IFRS profit for the period rose 31.3% to US$68.0 million. Relative to TPV, however, it fell from 49.8 cents to 37.1 cents per US$100. Interest income, finance costs, tax and other non-operating items mean that profit for the period is not a direct measure of payment-processing economics.
What the ratios do not show
TPV is the payment value flowing through dLocal's platform, not the number of transactions. A change in average transaction size can move these ratios even if merchant pricing is unchanged. The figures also combine payment methods, countries and flow types with different economics; they cannot reveal what any single merchant paid.
Investing.com's earnings-call analysis similarly described the quarter as rapid volume growth paired with take-rate compression. Its article said revenue missed the consensus estimate while earnings per share exceeded it. HaiPay relies on dLocal's SEC filings, not analyst estimates, for the calculations above.
What to watch
dLocal expects full-year TPV growth near the upper end of its 60% to 70% range, gross-profit growth near the midpoint of 25% to 30%, and operating-profit growth near the lower end of 27.5% to 32.5%. The next result will show whether operating expenses continue to grow more slowly than gross profit and whether gross profit per US$100 of TPV stabilises.
About HaiPay's mass payouts
HaiPay, which publishes this news section, offers mass payouts to local bank accounts and electronic wallets through a single API or batch upload, with automatic currency conversion and built-in AML and KYC controls. Available routes include Brazil Pix and selected markets in Latin America, Asia and Africa. Funding arrangements, limits and fees depend on the route and must be confirmed with the team. Learn more about HaiPay's mass payouts.
Data highlight
2.17 US dollars per US$100 of TPV
dLocal revenue per US$100 of total payment volume in Q3 2026
July-September 2026
HaiPay divided dLocal's Q3 2026 revenue of US$398.049 million by US$18.345 billion of TPV and multiplied by 100, producing US$2.1698 per US$100. The Q3 2025 equivalent is US$282.483 million divided by US$10.390 billion, or US$2.7188. This is a company-wide analytical ratio across payment flows, not a disclosed merchant price.
Data as of 13 November 2026 · UTC
Methodology and limitations
Compiled by HaiPay on 13 November 2026 from dLocal Limited's Q3 2026 earnings release and unaudited interim financial statements filed with the U.S. Securities and Exchange Commission. HaiPay divided reported revenue, gross profit, operating profit and profit for the period by reported total payment volume (TPV) for Q3 2026 and Q3 2025, then multiplied by 100, and separately derived operating expenses as gross profit minus IFRS operating profit. The underlying statements are unaudited interim statements prepared under IAS 34 and IFRS Accounting Standards as issued by the IASB. Operating expenses are HaiPay's derived subtotal—gross profit minus IFRS operating profit—not a separately presented line item. Percentages use unrounded values; displayed figures are rounded. These company-wide ratios combine pay-ins, payouts and local-to-local flows across markets and are not merchant prices or margins on individual transactions. HaiPay did not contact dLocal.
Data and research materials
- dLocal per-$100 TPV calculations, Q3 2026 versus Q3 2025 (HaiPay) ↓CSV · 2 KB
12 rows compiled by HaiPay on 13 November 2026 from dLocal Limited's Q3 2026 earnings release and unaudited IAS 34 / IFRS interim financial statements filed with the SEC. The file contains reported TPV, revenue, gross profit, operating profit and profit for the period, derived operating expenses, and HaiPay's per-US$100 TPV ratios and changes.
HaiPay's charts and CSV may be reused with attribution to HaiPay and a link to this article. dLocal reported the underlying company-wide amounts; the per-US$100 TPV ratios are HaiPay's calculations.
Term definition
- Total payment volume (TPV)
- The total dollar value of payments processed through dLocal's platform during the period.
- Revenue per $100 of TPV
- Reported revenue divided by TPV and multiplied by 100; a company-wide analytical ratio, not a quoted merchant price.
- Gross profit over TPV
- Gross profit divided by TPV; dLocal also reports this ratio as a percentage.
- Local-to-local
- Payment flows collected and settled within an emerging market rather than moving cross-border.
4 sources
- dLocal Limited
dLocal Reports Third Quarter 2026 Financial Results
Filed as Exhibit 99.1 on 12 November 2026: TPV, revenue, gross profit, operating expenses, operating profit, profit for the period, mix commentary and 2026 guidance.
Accessed 13 November 2026 · UTC
- dLocal Limited
dLocal Limited unaudited interim financial statements for Q3 2026
Unaudited IFRS financial statements for the three and nine months ended 30 September 2026 and 2025. Used to verify exact revenue, cost and profit amounts.
Accessed 13 November 2026 · UTC
- U.S. Securities and Exchange Commission
dLocal Limited Form 6-K for November 2026
Filed 12 November 2026, accession 0001846832-26-000037. Used to confirm the earnings release and interim statements as exhibits to dLocal's Form 6-K.
Accessed 13 November 2026 · UTC
- Investing.com
Earnings call transcript: DLocal tops EPS in Q3 2026 but shares fall on revenue miss
Independent earnings-call analysis dated 13 November 2026. It described fast TPV growth alongside take-rate compression; HaiPay did not use it as the source of company figures.
Accessed 13 November 2026 · UTC
How to cite
HaiPay News, "dLocal Revenue per $100 of TPV Falls to $2.17 in Q3", https://www.haipay.net/news/dlocal-q3-2026-revenue-per-100-tpv, 13 November 2026