A Billion-Dollar Month for Stablecoin Cards, Measured Twice
Paymentscan's overview page records $1,038 million of stablecoin card spending in July 2026, against $339.4 million a year earlier. Its currency page records $642.3 million for the same month. Neither number is wrong; they answer different questions, and the percentages that travelled with the headline came from the second one.
August 24th, 2026
Last updated: August 24
Key takeaways
- Stablecoin card spend hit $1,038m in July 2026 against $339.4m a year earlier, a factor of 3.06 on the headline basis.
- The same dashboard publishes a second July total of $642.3m covering only flows it observes on-chain.
- The reported USDC share of 50% is measured on that $642.3m, not on the $1.04bn headline.
- Against the headline total USDC would be 31.5% and USDT 12.6%, not 50% and 20.3%.
- Counting only on-chain flows, July spend grew 8.91 times year on year, far faster than the blended figure.
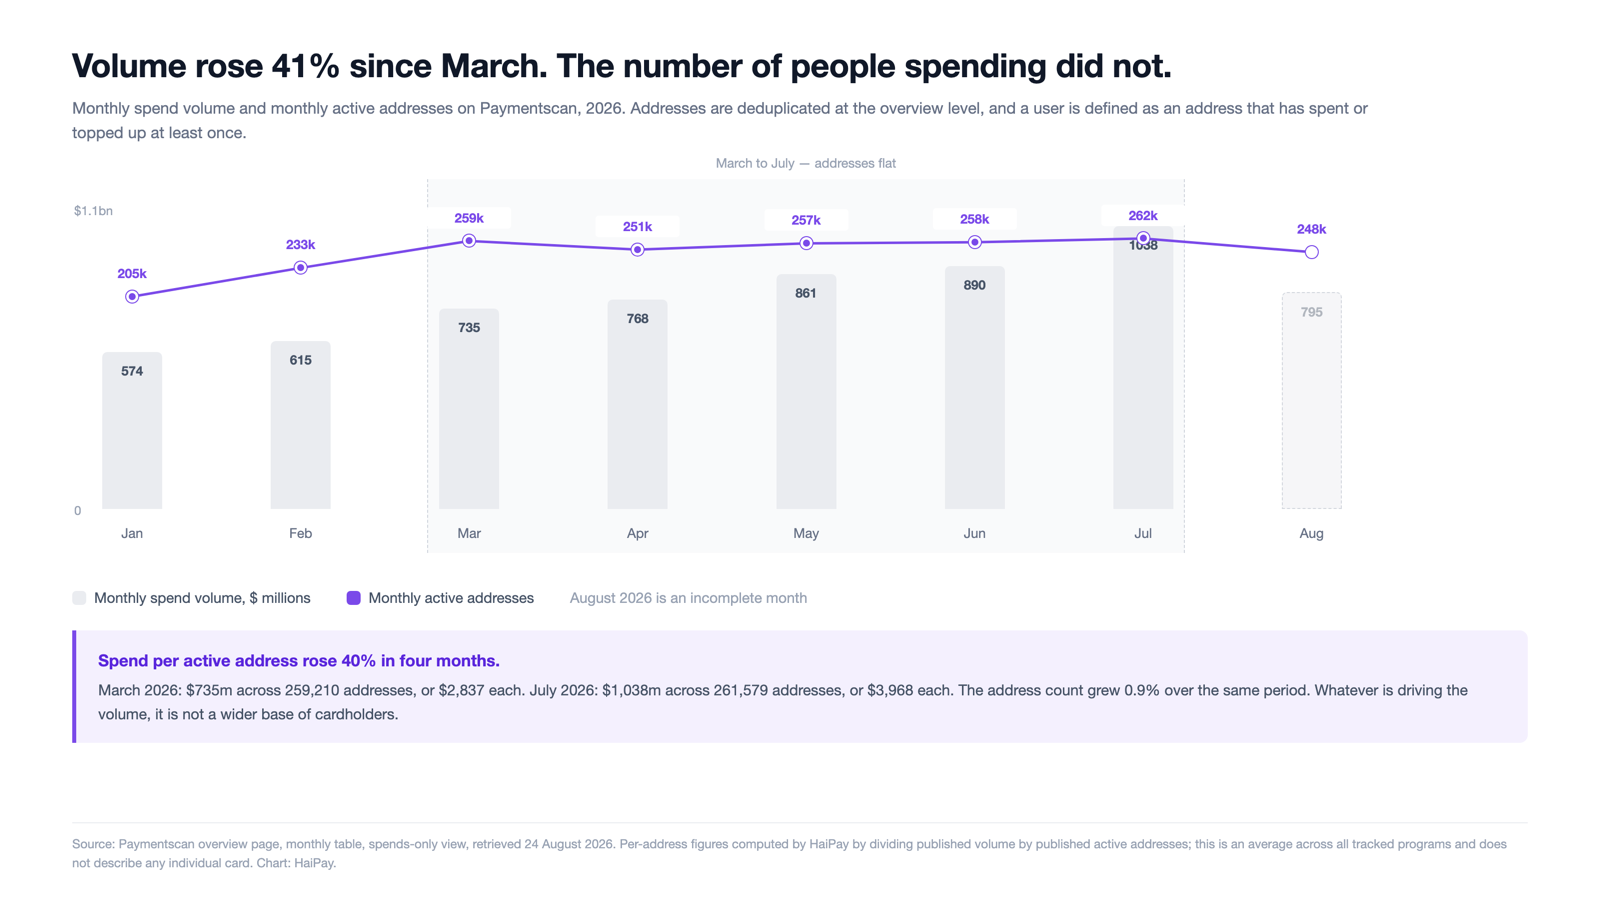
- Monthly active addresses rose 0.9% between March and July while volume rose 41.2%.
Data highlight
61.9percent
Share of the headline stablecoin card spend figure that is observed on-chain, July 2026
2026-07
Comparison of the two monthly tables Paymentscan publishes for the same period and the same spends-only setting: the overview page total, which blends indexed on-chain activity with offchain feeds supplied by two issuers, and the currencies page total, which the site states reflects on-chain flows only. The on-chain share is the second divided by the first. Overview July 2026 = $1,038m; currencies July 2026 = $642.3m; difference $395.7m = 38.1%. The on-chain share has risen from 21.2% in July 2025; across the whole series from March 2023 the totals are $10.92bn and $4.81bn, an on-chain share of 44.0%. Figures are as published on 24 August 2026 and will change as the dashboard updates. The comparison assumes the difference between the two published series is entirely the offchain component, which follows from the currencies page's own statement but is not separately itemised by the dashboard.
Stablecoin card spending passed a billion dollars in a month for the first time in July, and the number has been widely repeated since a report last Sunday. It is a real number from a source that documents itself unusually well.
It is also two different numbers, and the widely quoted currency split belongs to the smaller one.
The headline checks out
The figure comes from Paymentscan, a dashboard that indexes stablecoin card activity across twenty-odd chains and twenty-five card programmes. Its overview page, set to count spending rather than deposits, records $1,038 million for July 2026 against $339.4 million for July 2025. That is 3.06 times, which is what "more than tripled" means, and it is correct.
August is running at $795.2 million so far, but the month is not over and the dashboard does not state the date its data stops, so nothing can be concluded from that yet.
The dashboard publishes two totals for the same month
Paymentscan has a second page that breaks spending down by settlement currency. For July 2026 that page totals $642.3 million, not $1,038 million. The gap is $395.7 million, or 38% of the headline.
The page explains why, in its own words: it "reflects onchain flows only, as offchain feeds for RedotPay spends and BFinance do not provide a currency-level breakdown." Two of the twenty-five tracked programmes report their spending to Paymentscan through an issuer API rather than being observed on a blockchain, and those two cannot be split by currency, so the currency page leaves them out.
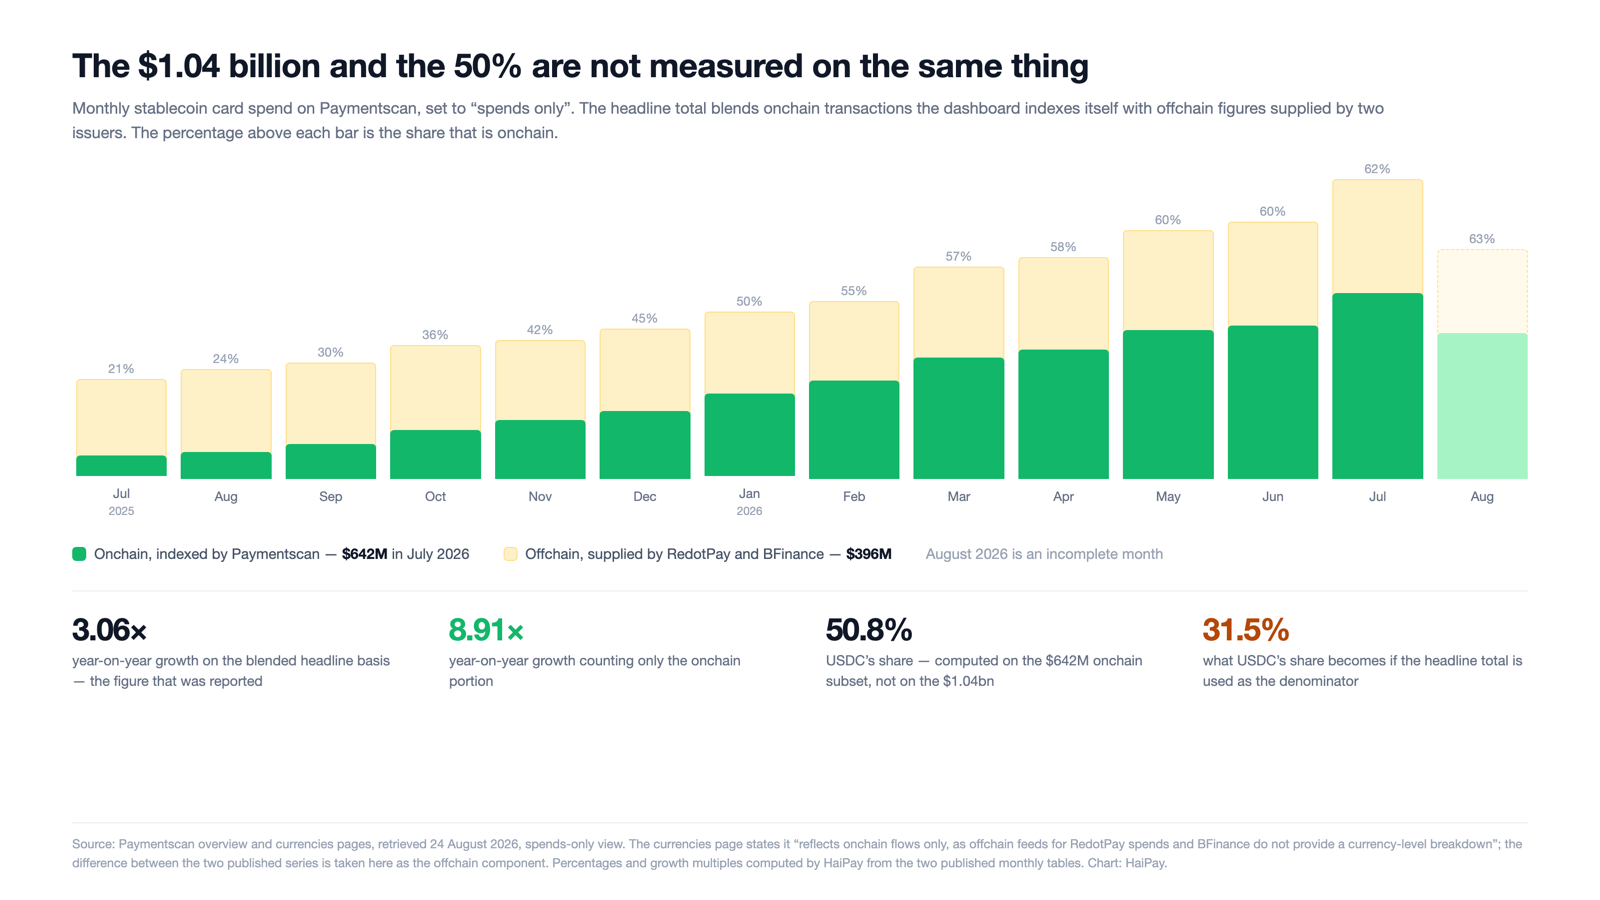
Neither total is wrong. They answer different questions. The overview answers "how much was spent on these cards", taking two issuers at their word. The currency page answers "how much can we see on-chain and attribute to a specific stablecoin".
The fifty per cent is measured on the smaller total
The report that circulated last weekend carried both figures together: $1.04 billion in July, with USDC at 50% of stablecoin volume and USDT at 20.3%.
Those percentages are accurate, and they are not percentages of $1.04 billion. Computed against the currency page's own July total of $642.3 million, USDC comes to 50.8% and USDT to 20.3% — matching the reported figures to a decimal place, which is how we know which denominator they came from.
Applied to the headline total instead, USDC would be 31.5% and USDT 12.6%. The difference is not a small rounding matter. It is the difference between saying half of all stablecoin card spending settles in USDC and saying half of the portion that can be observed on-chain does.
On the observable portion, growth was nearly ninefold
This cuts in an unexpected direction. The offchain component has grown slowly — from $267 million in July 2025 to $396 million in July 2026, up 48%. The on-chain component went from $72.1 million to $642.3 million, a factor of 8.91.
So the on-chain share of the headline has climbed from 21% a year ago to 62% now. The blended "threefold" figure is the conservative one. Anyone using it as evidence of how fast on-chain card settlement is growing is understating the case by a wide margin, because it is diluted by a slower-growing series that is not on-chain at all.
Across the whole history the dashboard covers, from March 2023, the two series total $10.92 billion and $4.81 billion. Forty-four per cent of the cumulative headline is on-chain.
The number of people spending stopped growing in March
The overview page carries a third column that the coverage did not mention. Monthly active addresses were 259,210 in March 2026 and 261,579 in July — a rise of 0.9%. Over the same four months volume rose 41.2%.
Average spend per active address went from $2,837 to $3,968, up 39.9%. Transactions rose 17.2%, well behind volume, so the average transaction also got larger.
Paymentscan defines a user as an address that has spent or topped up at least once, and says overview-level counts are deduplicated across chains. On that basis, the growth since March has come from the existing base spending more, not from more people holding these cards. For a merchant deciding whether stablecoin cards represent a new customer segment, that distinction matters more than the billion-dollar figure does.
What the dashboard says about itself
Paymentscan's methodology page is more forthcoming than most vendor data. It states that it indexes on-chain data itself and verifies its approach with issuers where possible; that offchain data comes from a small number of issuers via API and can be switched off with a toggle; that some issuers use batched or centralised settlement so only top-ups can be tracked, and that top-ups may not correspond to spend; that RedotPay's spend figures are self-reported while its top-ups are tracked on-chain; that transactions on chains it does not index are not counted; and that non-dollar tokens are priced at the day's open.
It also warns about the trap most directly: users active on more than one chain are counted once per chain on chain-level charts, and only the overview page is deduplicated. None of this is hidden. It sits on a page linked from the top of the site.
What is established and what is not
Established: Paymentscan's overview records $1,038 million of stablecoin card spend in July 2026 against $339.4 million a year earlier, a factor of 3.06. Its currency page records $642.3 million for the same month and states that it excludes offchain feeds from RedotPay and BFinance. USDC is 50.8% and USDT 20.3% of that $642.3 million. Monthly active addresses rose 0.9% between March and July while volume rose 41.2%. The dashboard publishes a methodology page setting out its offchain feeds, its spend-versus-top-up handling and its chain coverage.
Not established: what share of the offchain component is RedotPay and what share is BFinance, which the dashboard does not break out; the date to which August data runs; whether the flat address count reflects saturation, deduplication effects, or programmes leaving the sample; and how much of the tracked volume is genuine merchant spend rather than cash-out behaviour, which no public dataset separates. We did not attempt to verify the underlying chain indexing, and we have no relationship with any tracked programme.
The narrow reading is that a billion-dollar month is real, that the currency split describes 62% of it, and that on the part anyone can independently check, the growth is much faster than the headline suggests while the number of people doing the spending has not moved since March.
How to cite
HaiPay News, "A Billion-Dollar Month for Stablecoin Cards, Measured Twice", https://www.haipay.net/news/stablecoin-card-billion-month-two-denominators, August 24th, 2026
About the author
Crystal
Digital Public Relations
A digital PR specialist with a Master's in Journalism & Communication from UNSW. Started as an intern at ABC Australia, now leads public relations at Haipay, crafting press releases and media strategies that bring brand stories to life.
Reviewed by WeiJun TangEditorial policy